0→1 Creating for Jira for farm management
Shipped build-ready cross-platform product flows using AI-accelerated prototyping to compress design feedback loops by 67%.

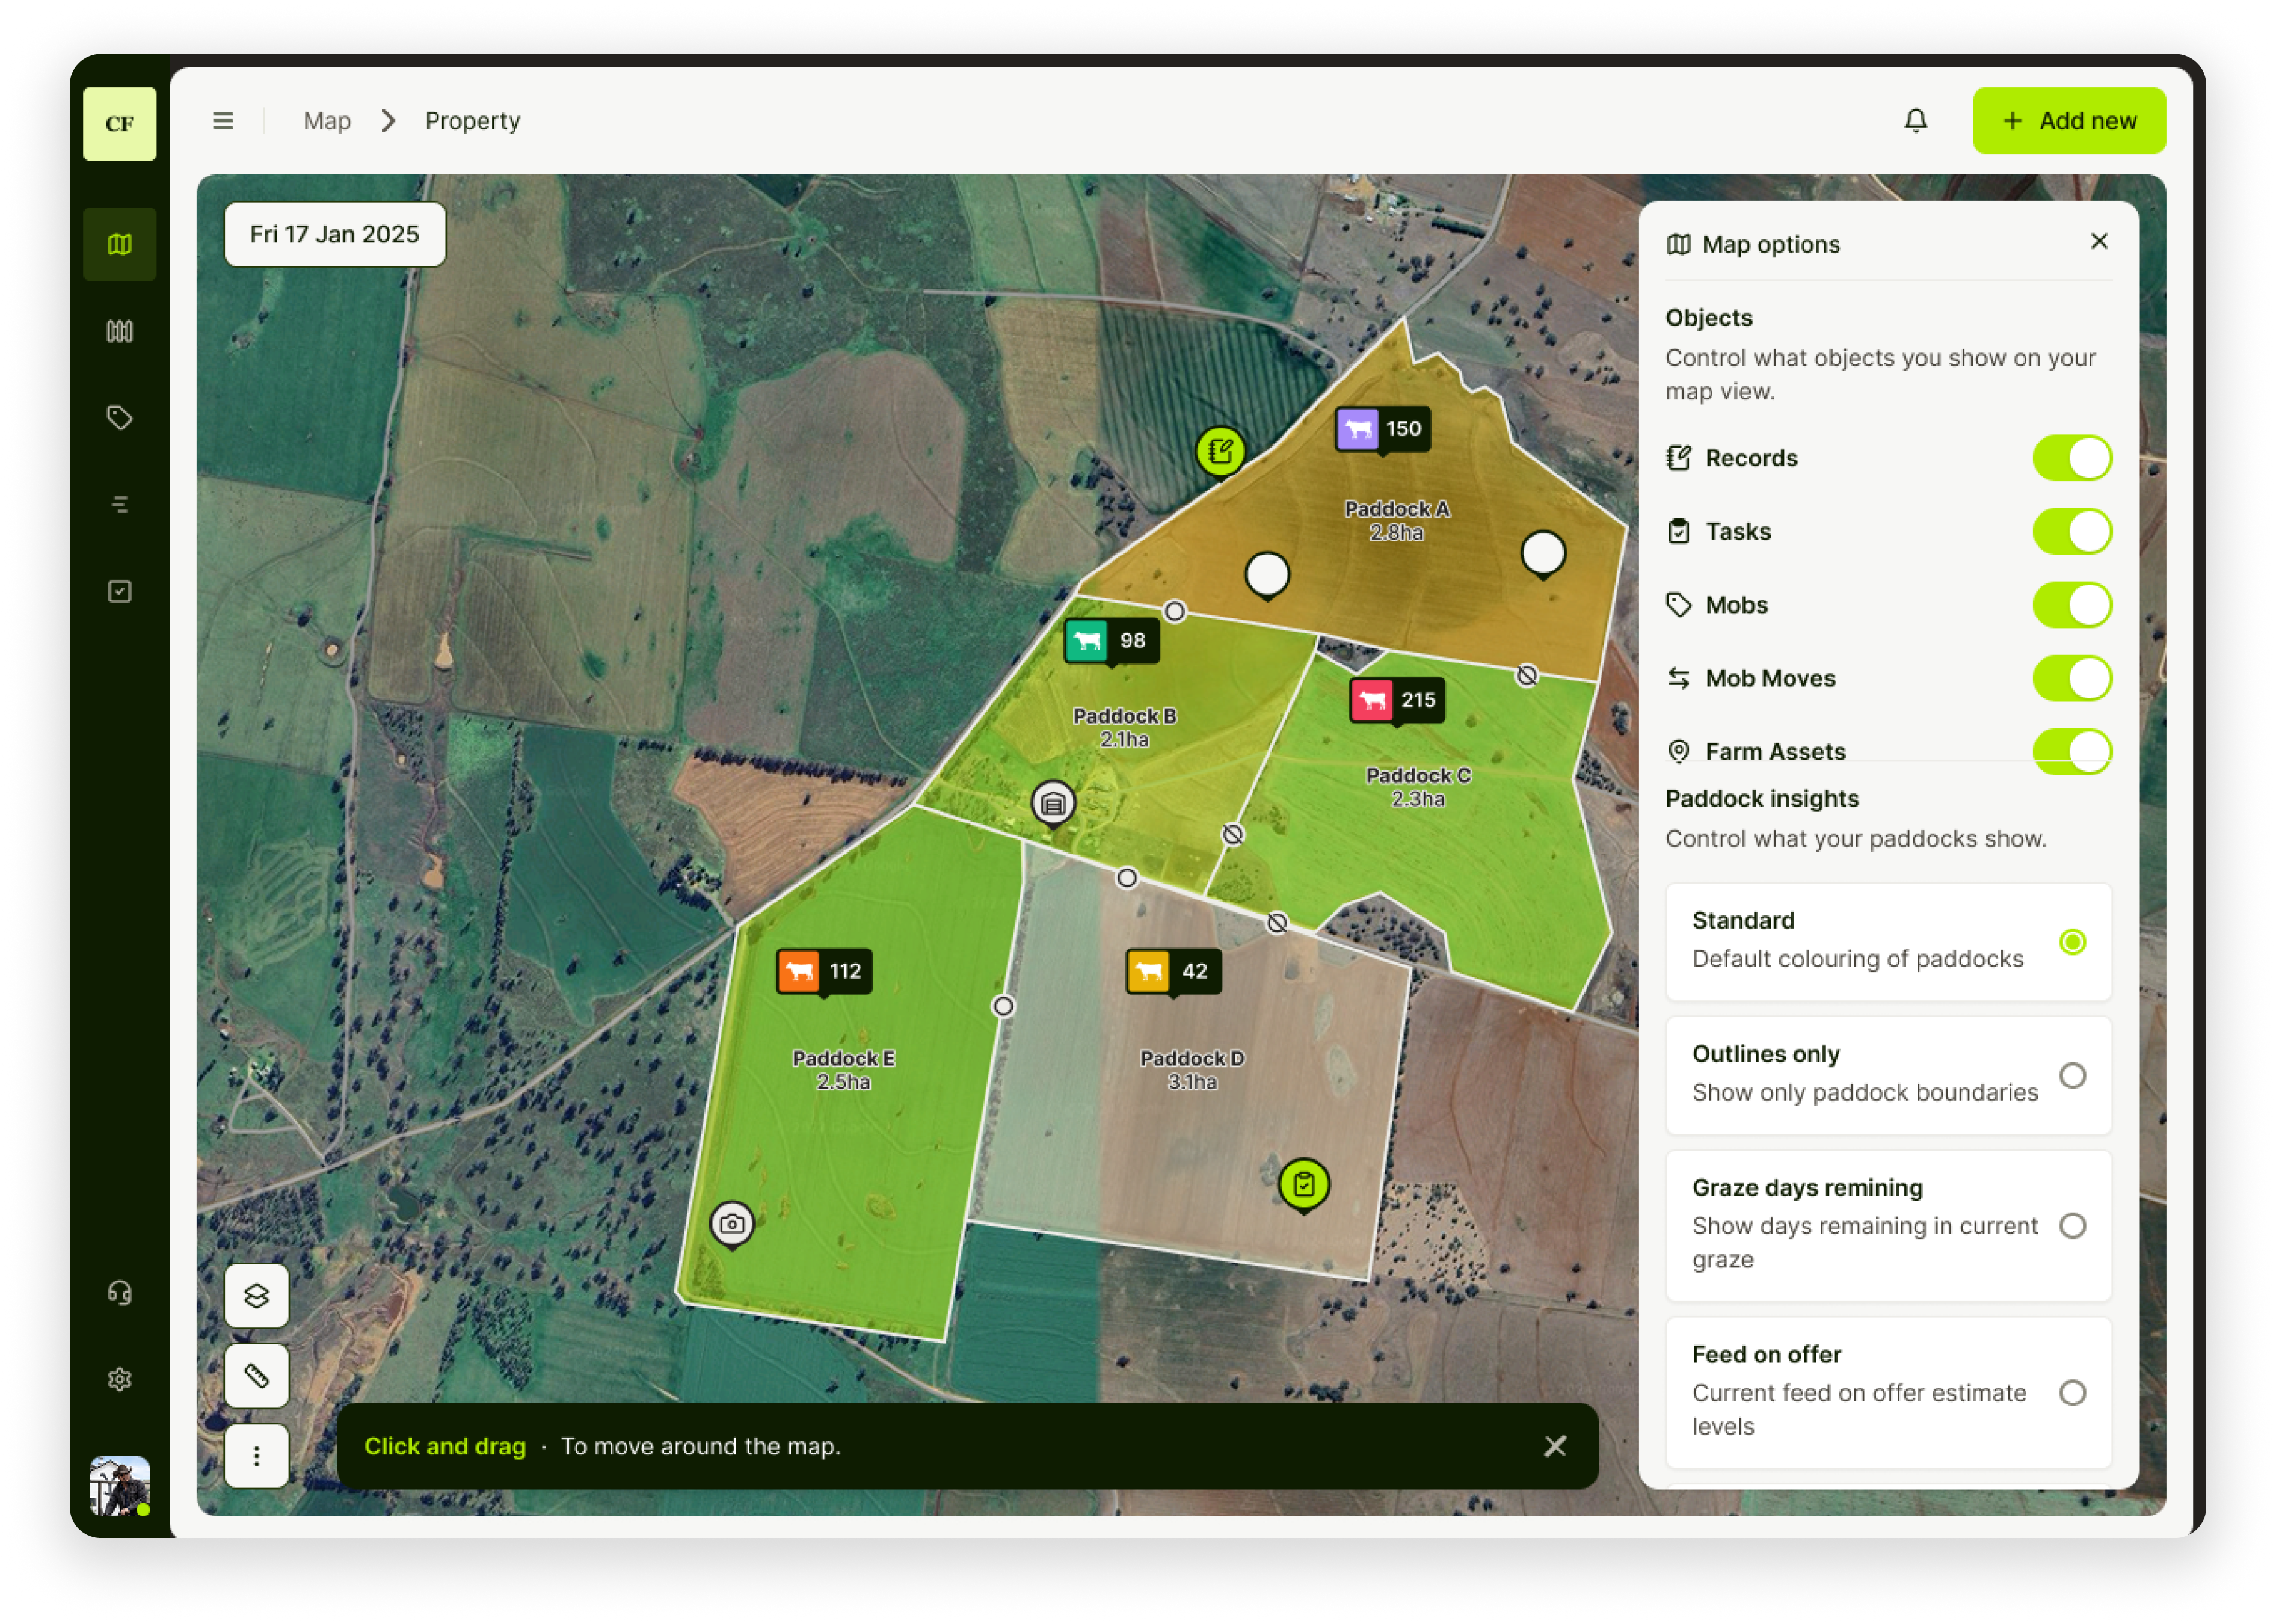
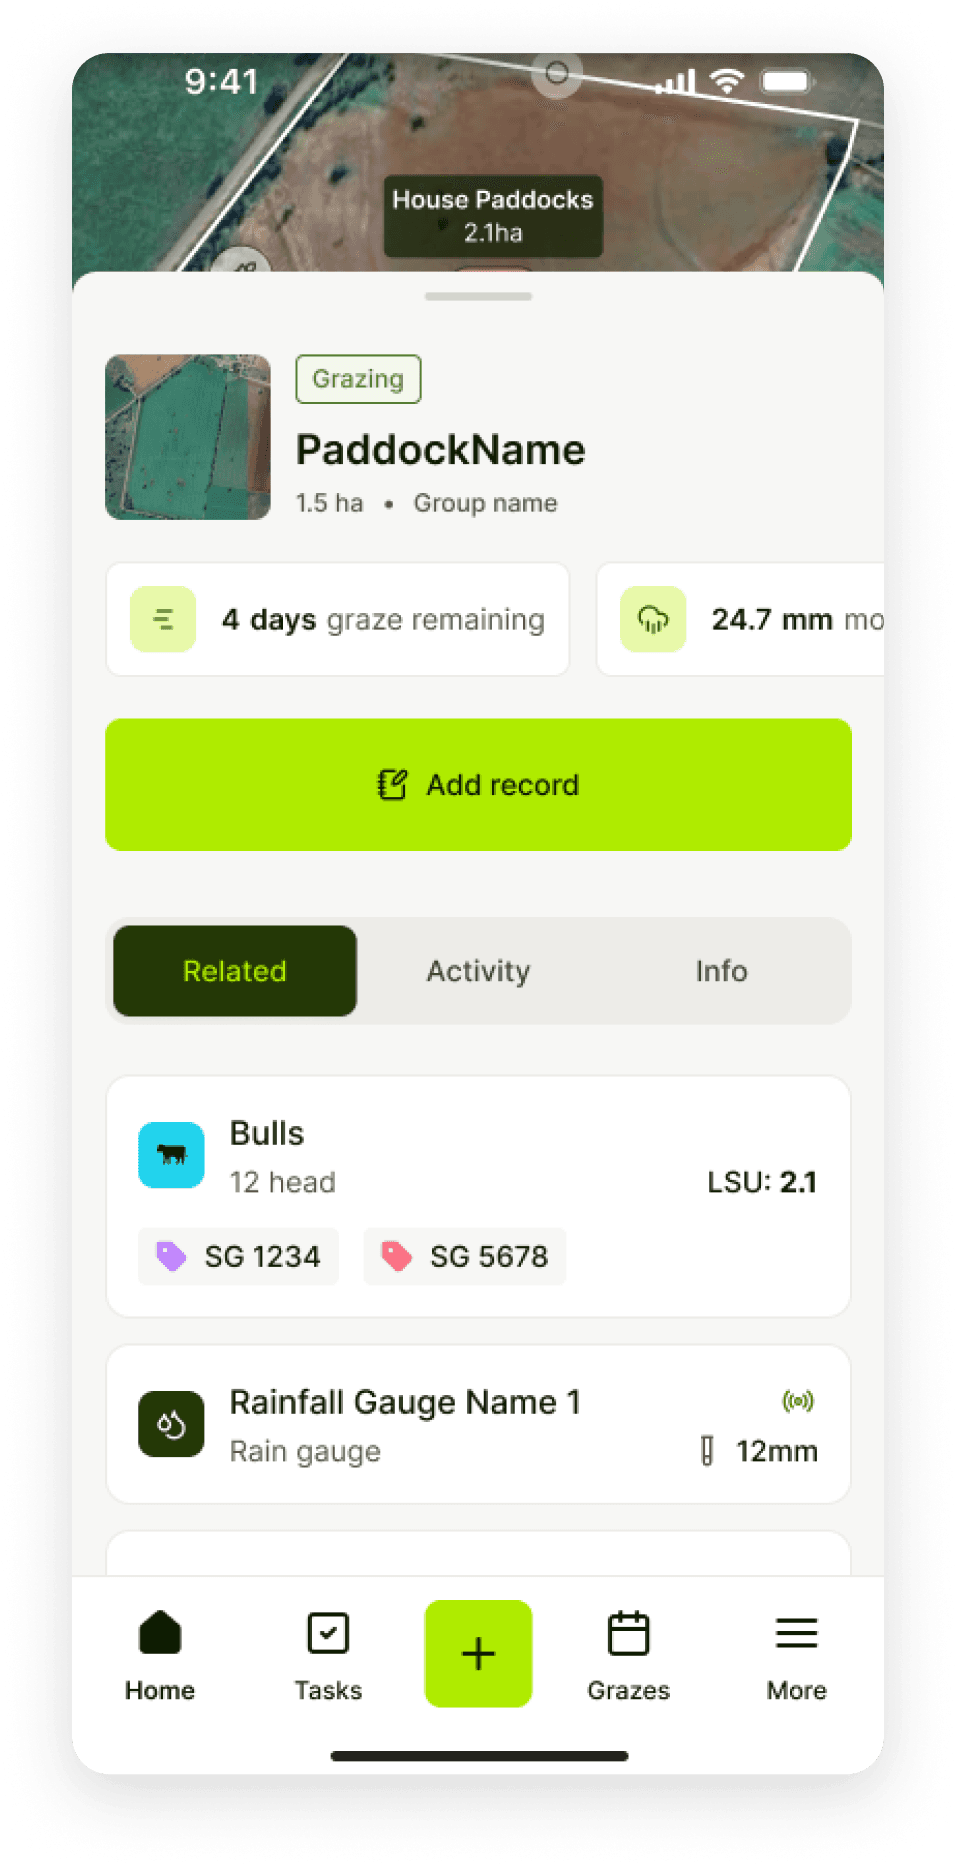
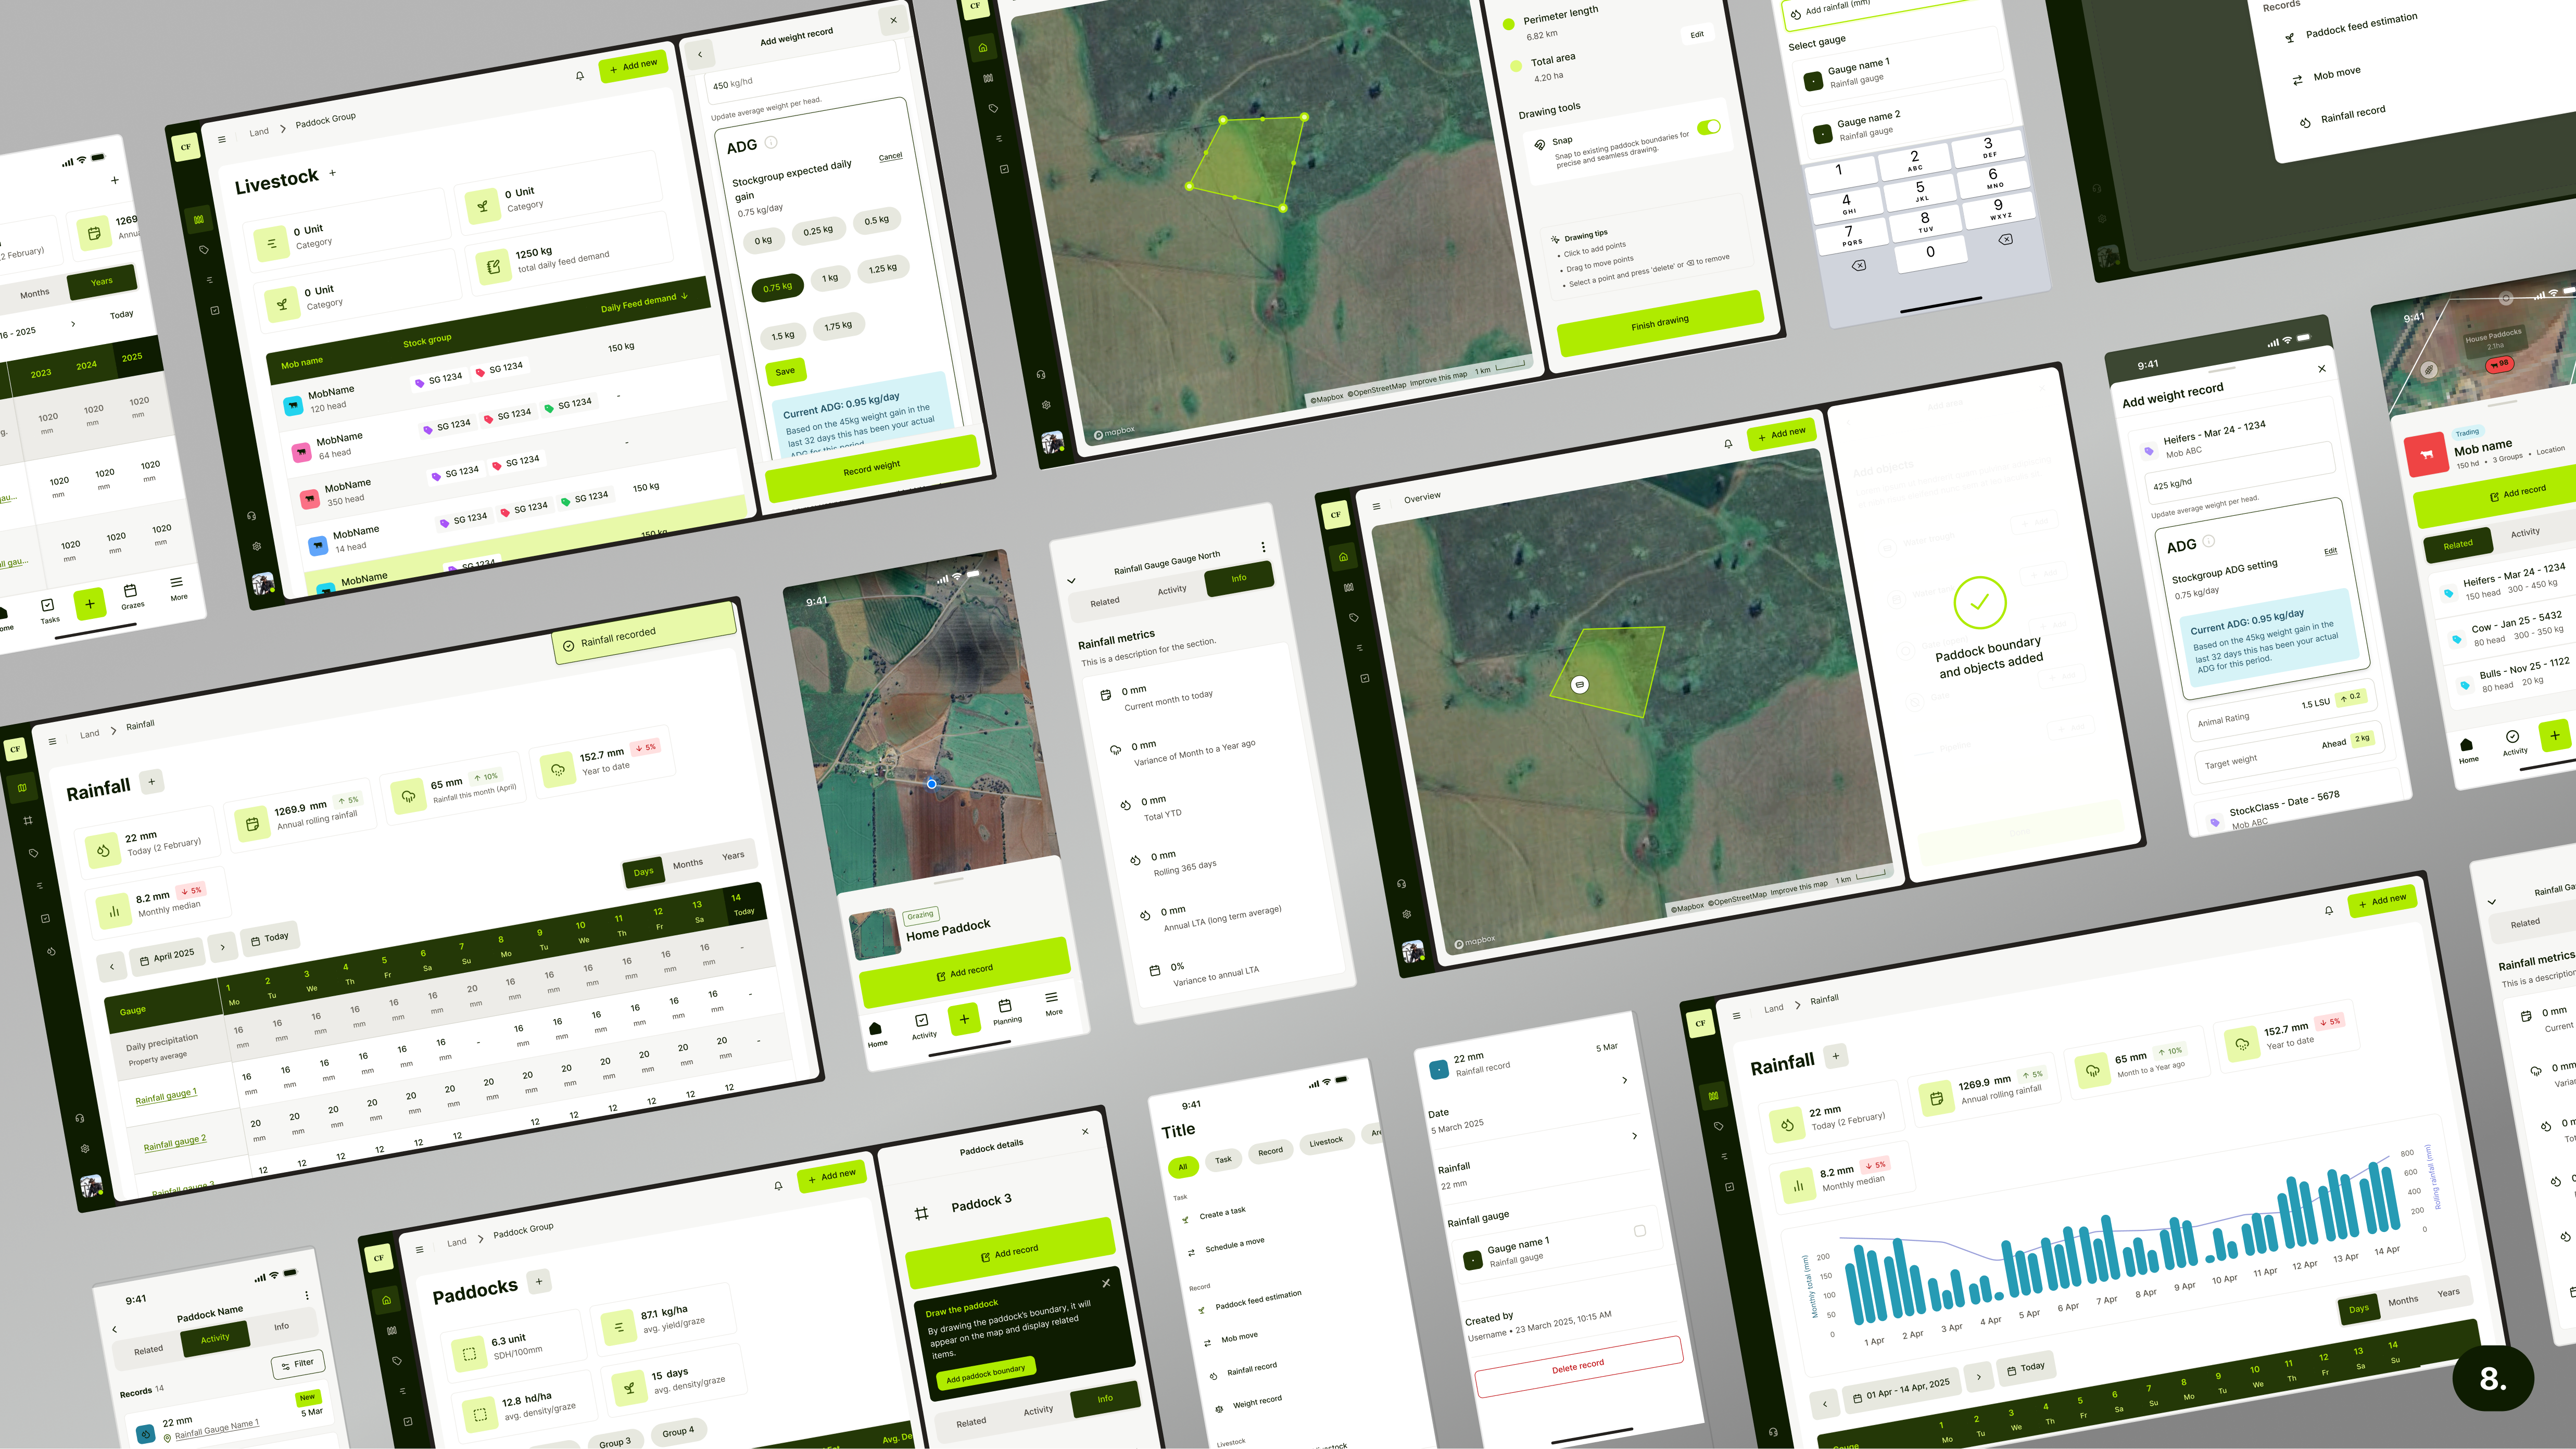
Funded agtech startup building a multi-platform farm management product for farmers in Australia and the US. End-to-end design on planning tools, dashboards, and data visualisation across mobile app, mobile web, and desktop web.
Goal: ship build-ready flows fast enough to outpace a competing product racing to market.
- Role
- Lead Product Designer
- Period
- 2025
- Stack
- FigmaMiroV0.appChatGPTGluestack-uiTailwindCSS
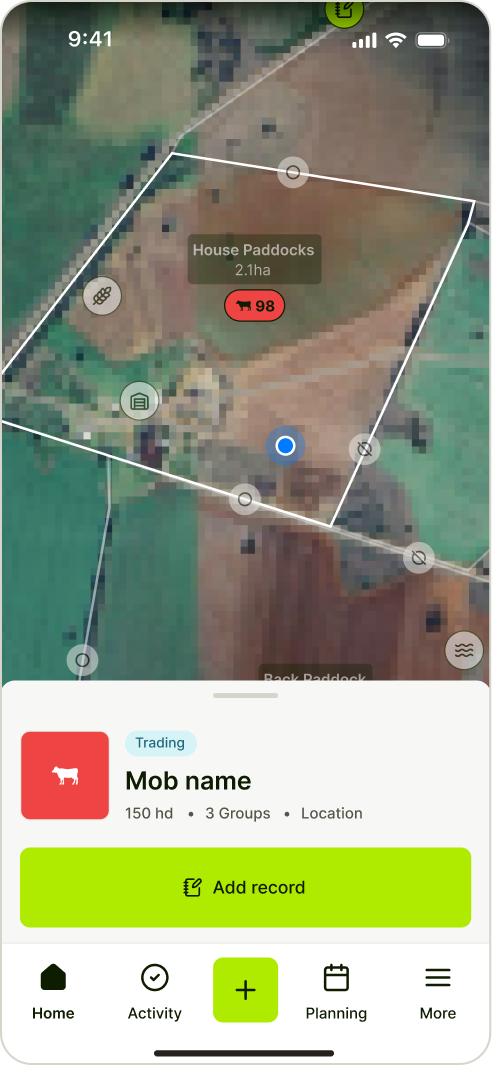
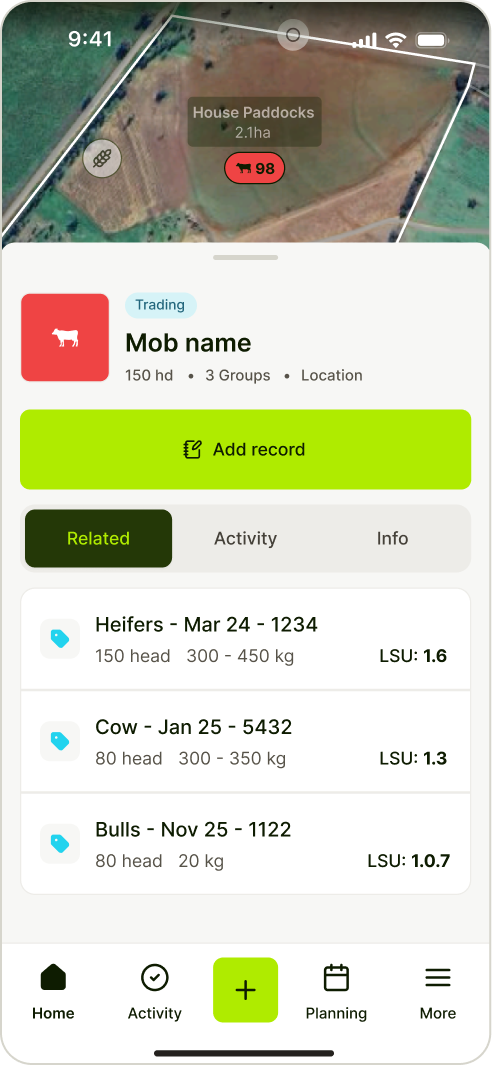
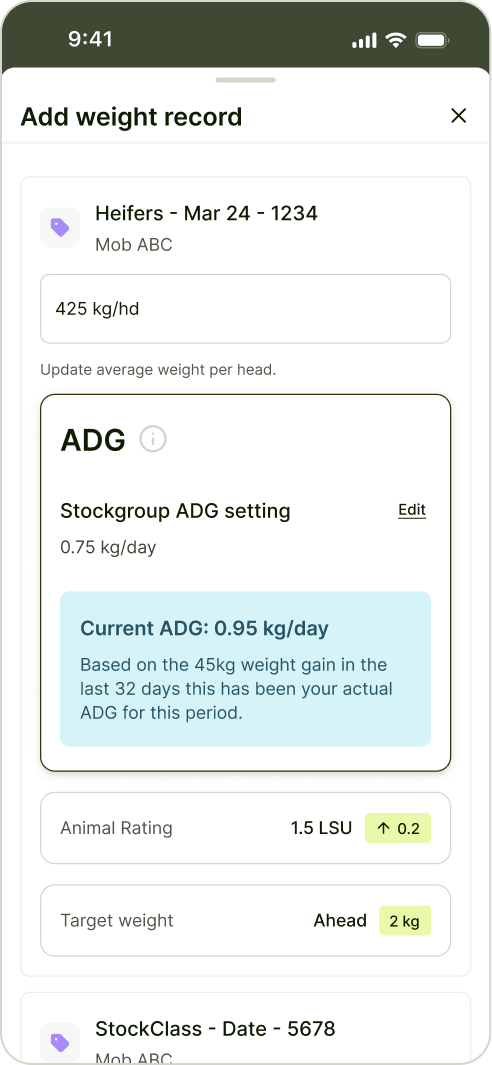
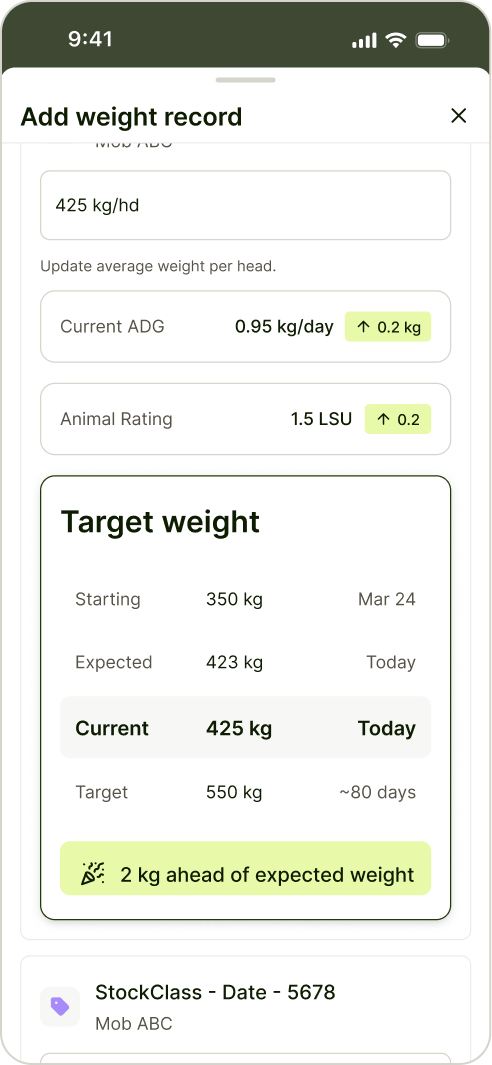
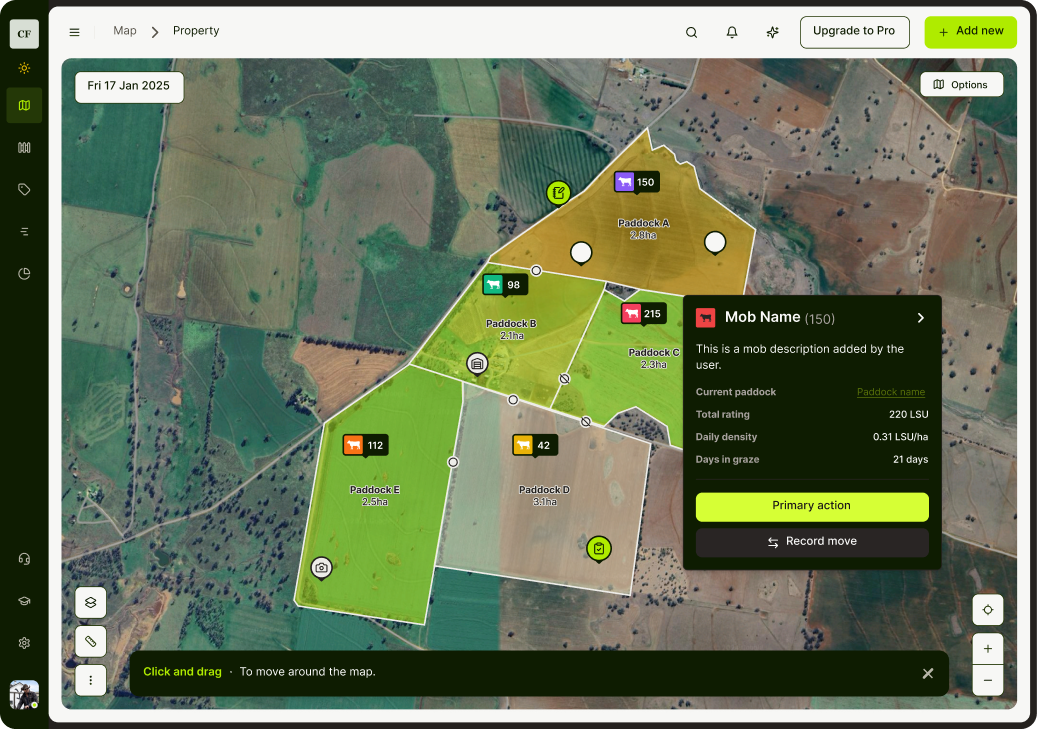
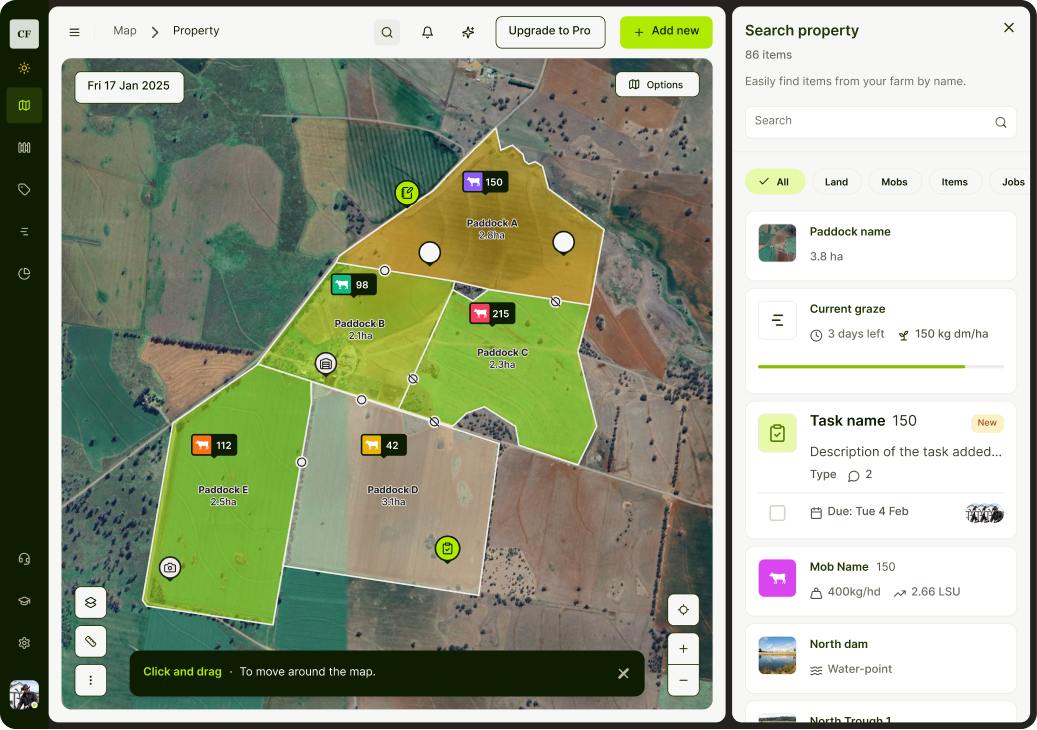
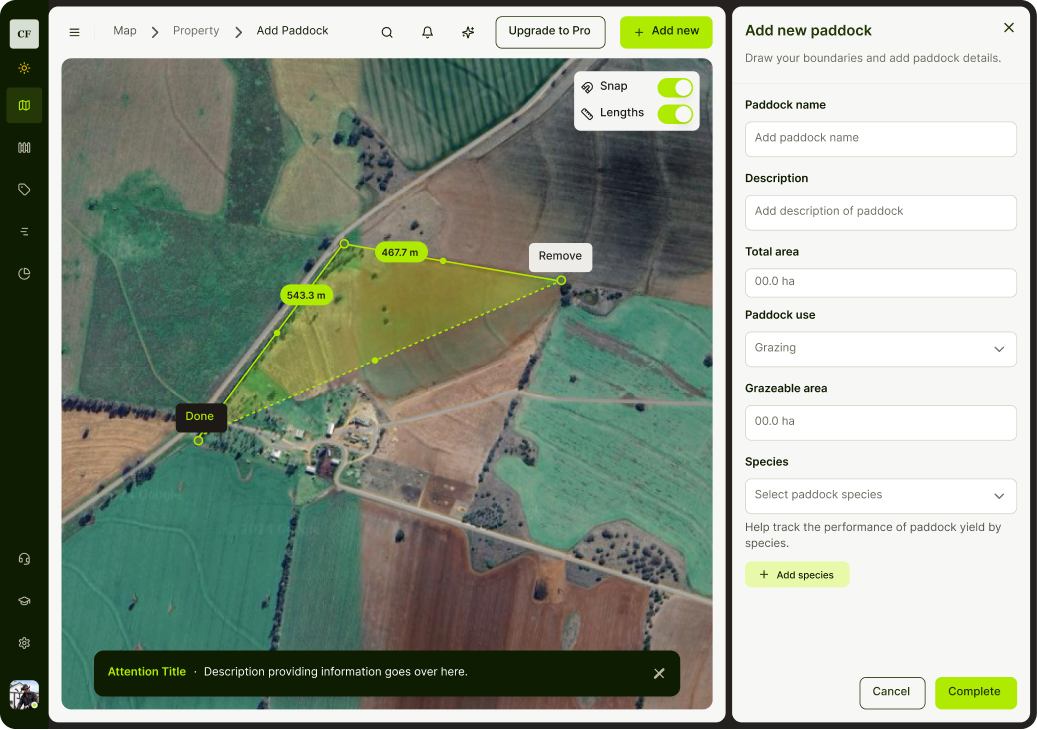
A design process focused in AI-accelerated loops
With no time for traditional discovery and requirements held mentally by the Product Owner, we leaned on AI UI generation tools (Readily, Replit) to compress the design feedback loop. AI output became our low-fi exploration: what would normally be an hour of wireframing was 20 minutes of generated screens to react against. Gluestack ui as the underlying component scaffolding kept designs build-ready from sprint 1.
The Work
Two highlighted key feature areas:
- 1
Rainfall Monitoring (desktop web) — turning raw data into a planning surface
- 2
Paddock planning (mobile web) — map-first interaction for in-field decisions
Feature 1 - Rainfall Monitoring
Turning rainfall data into a planning surface, not a logbook
The problem
Farmers were tracking rainfall in spreadsheets, diaries and notebooks. Fine for records, useless for making actionable decisions. The platform needed to convert that data into something they could plan grazing rotations and feed demand against.
Constraint: No usability research budget, and a competing product racing to market. We had to commit to an interaction model from day-one and refine through the Product Owners SME knowledge, not user testing.
The solution
Used AI UI generation tools to rapidly visualise solutions and played them back to the PO for same-day approval. Led with a calendar-first view (familiar mental model from existing tools) and layered visualisation underneath. Calendar handles daily entry, chart handles trend reading.
 readily.ai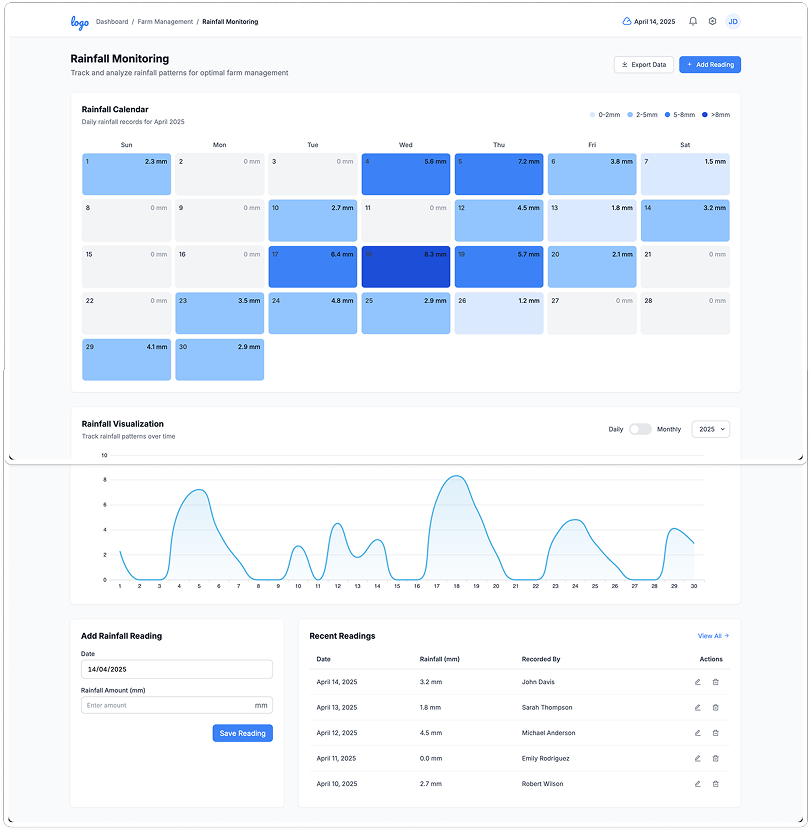
 v0.app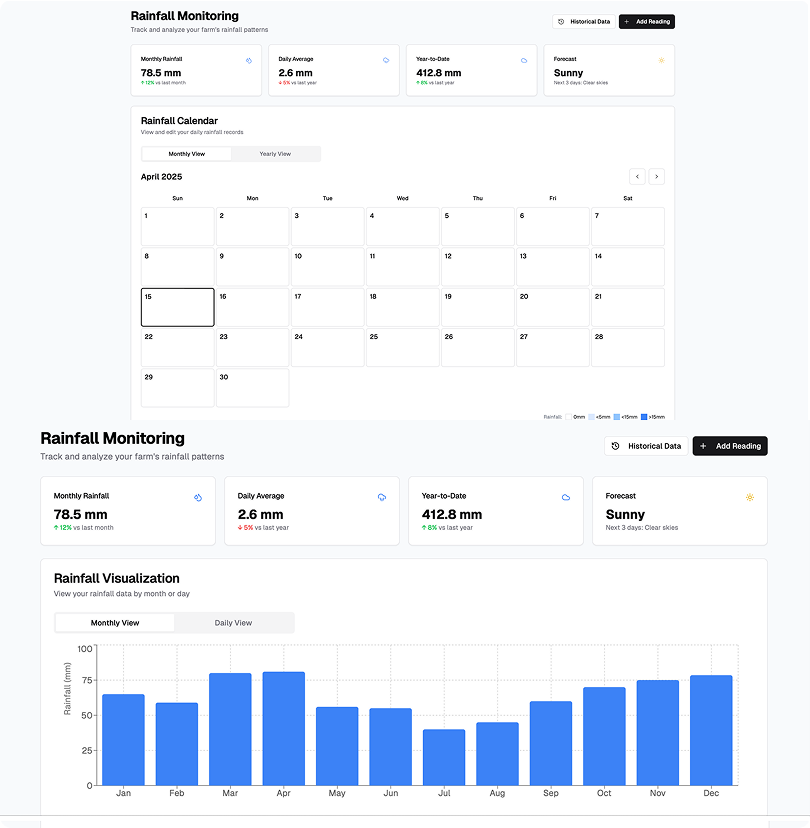
 replit.com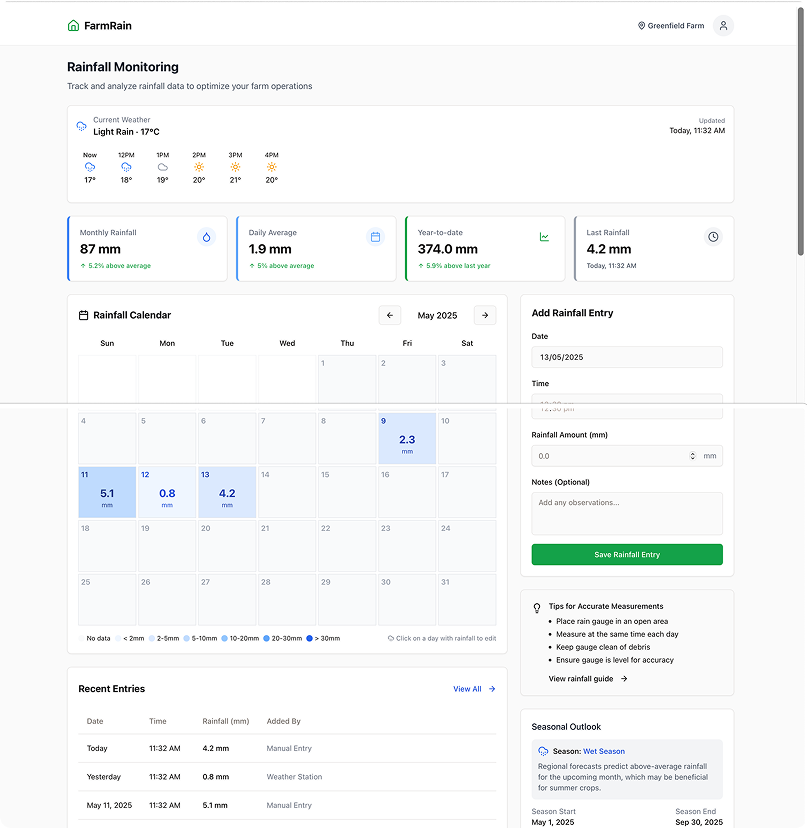
What we rejected
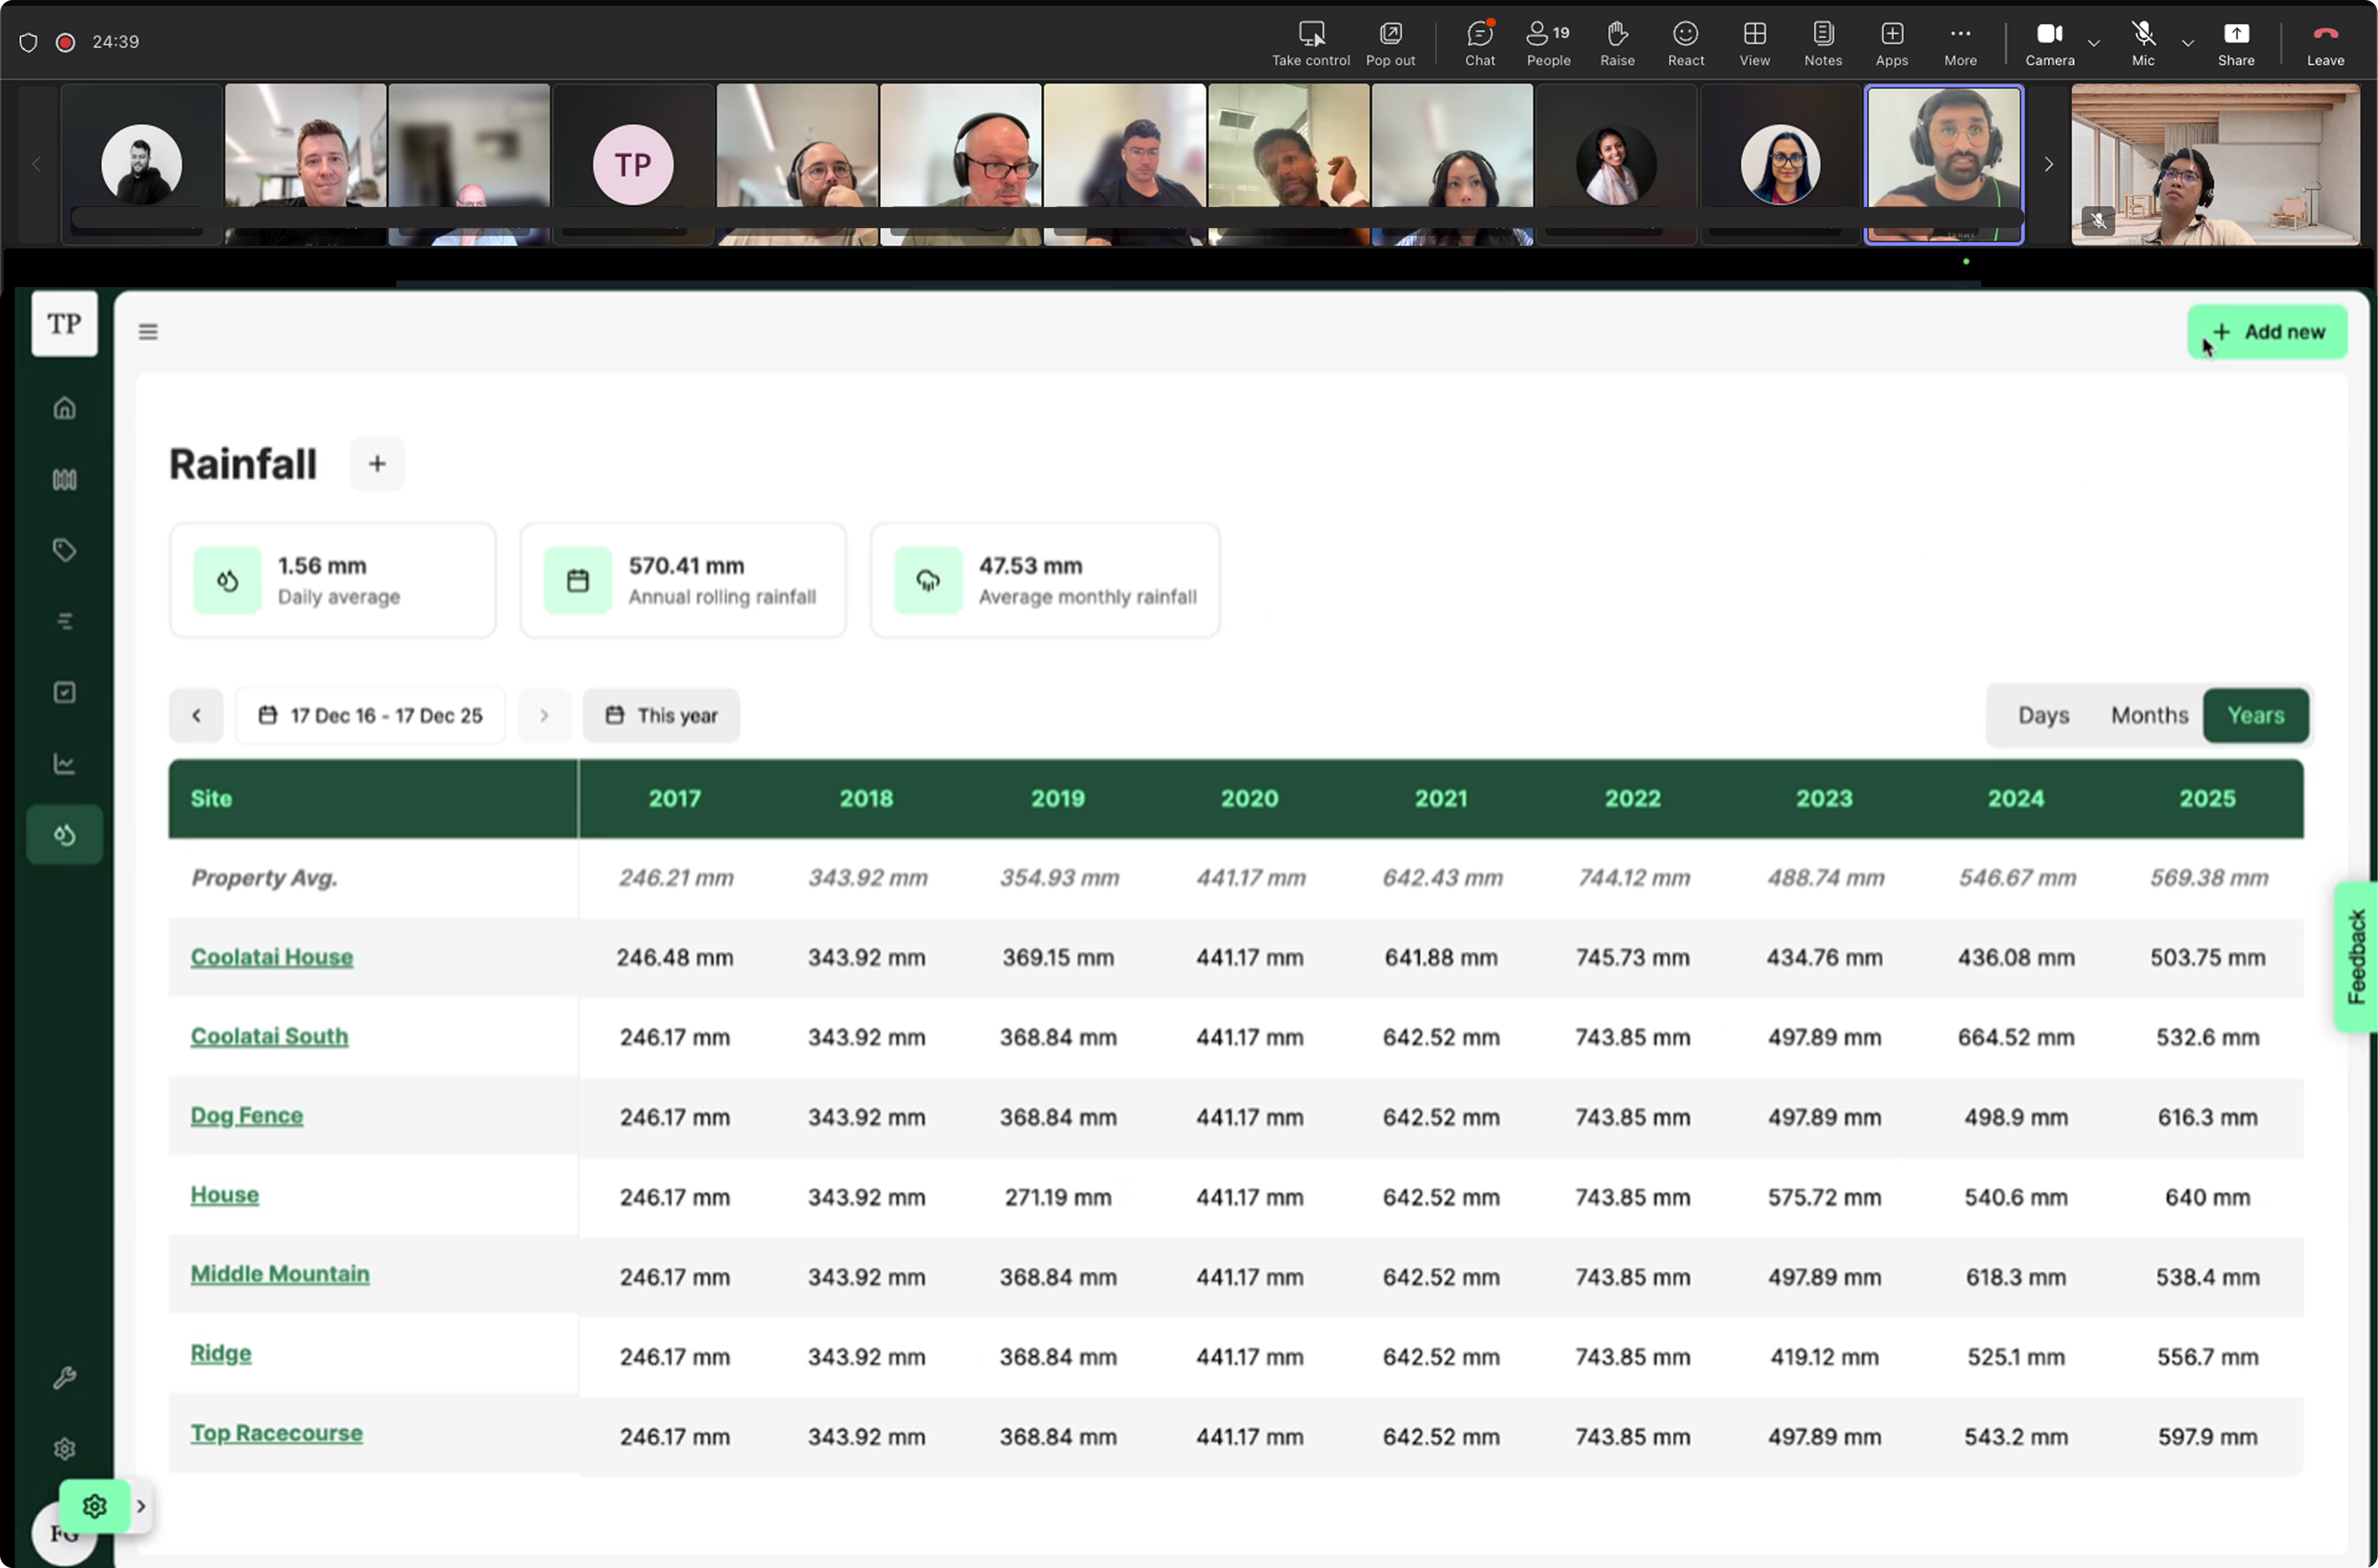
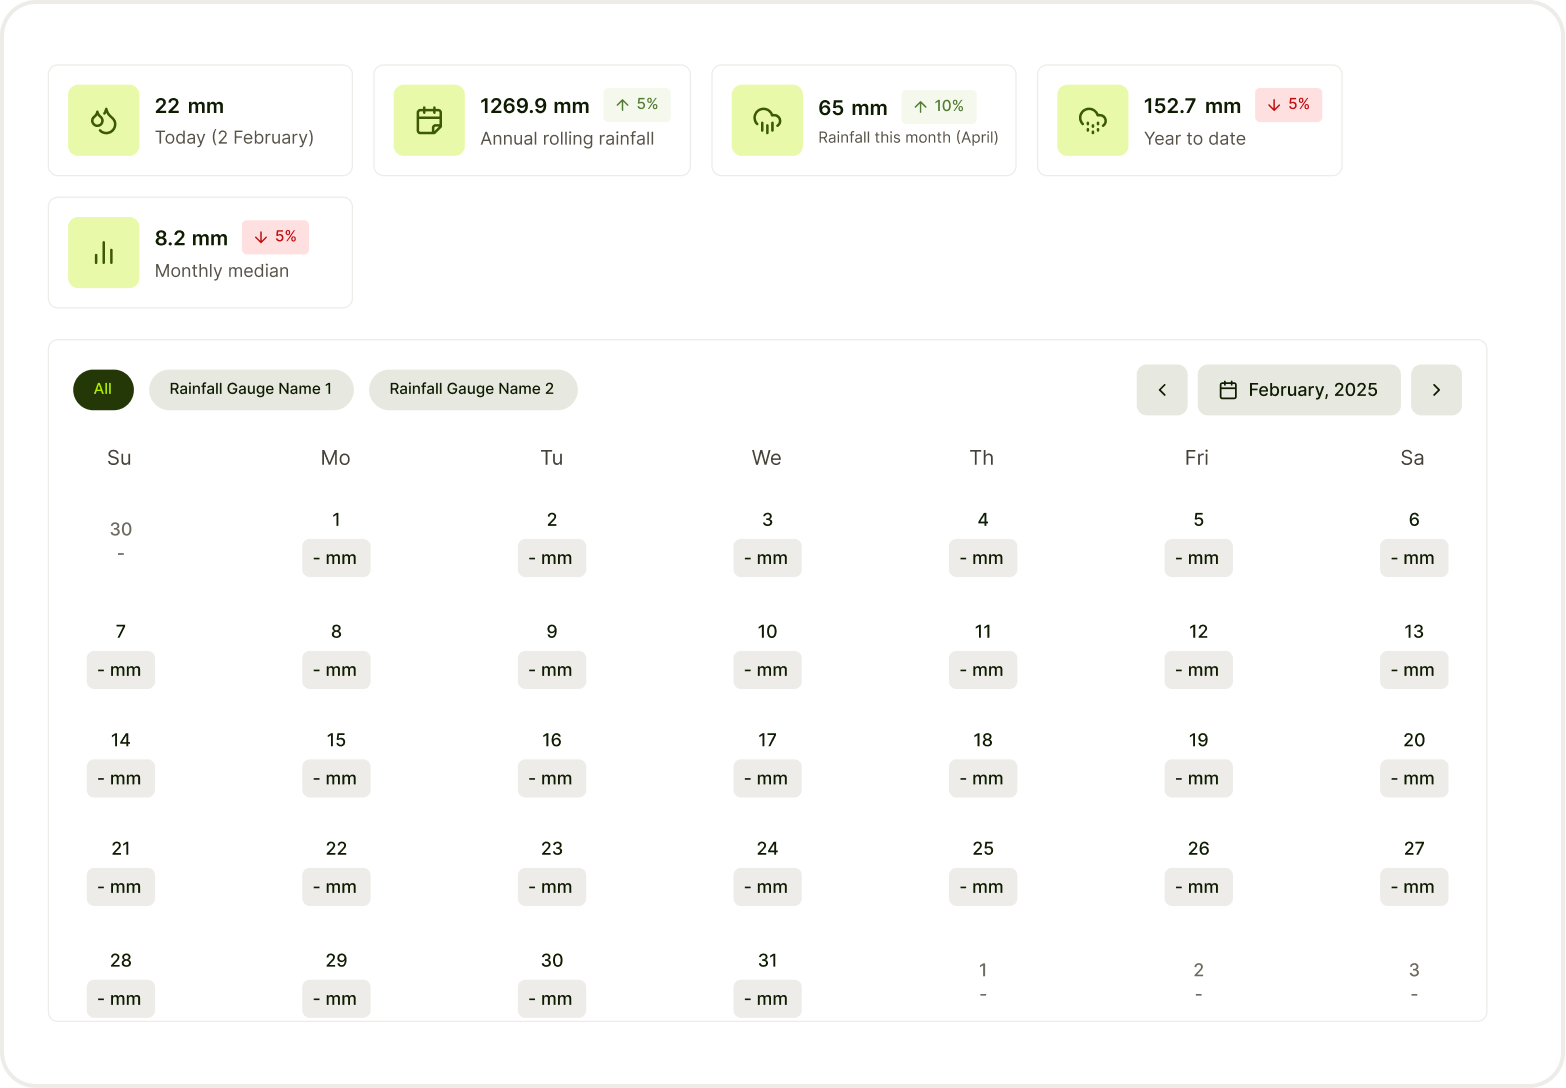
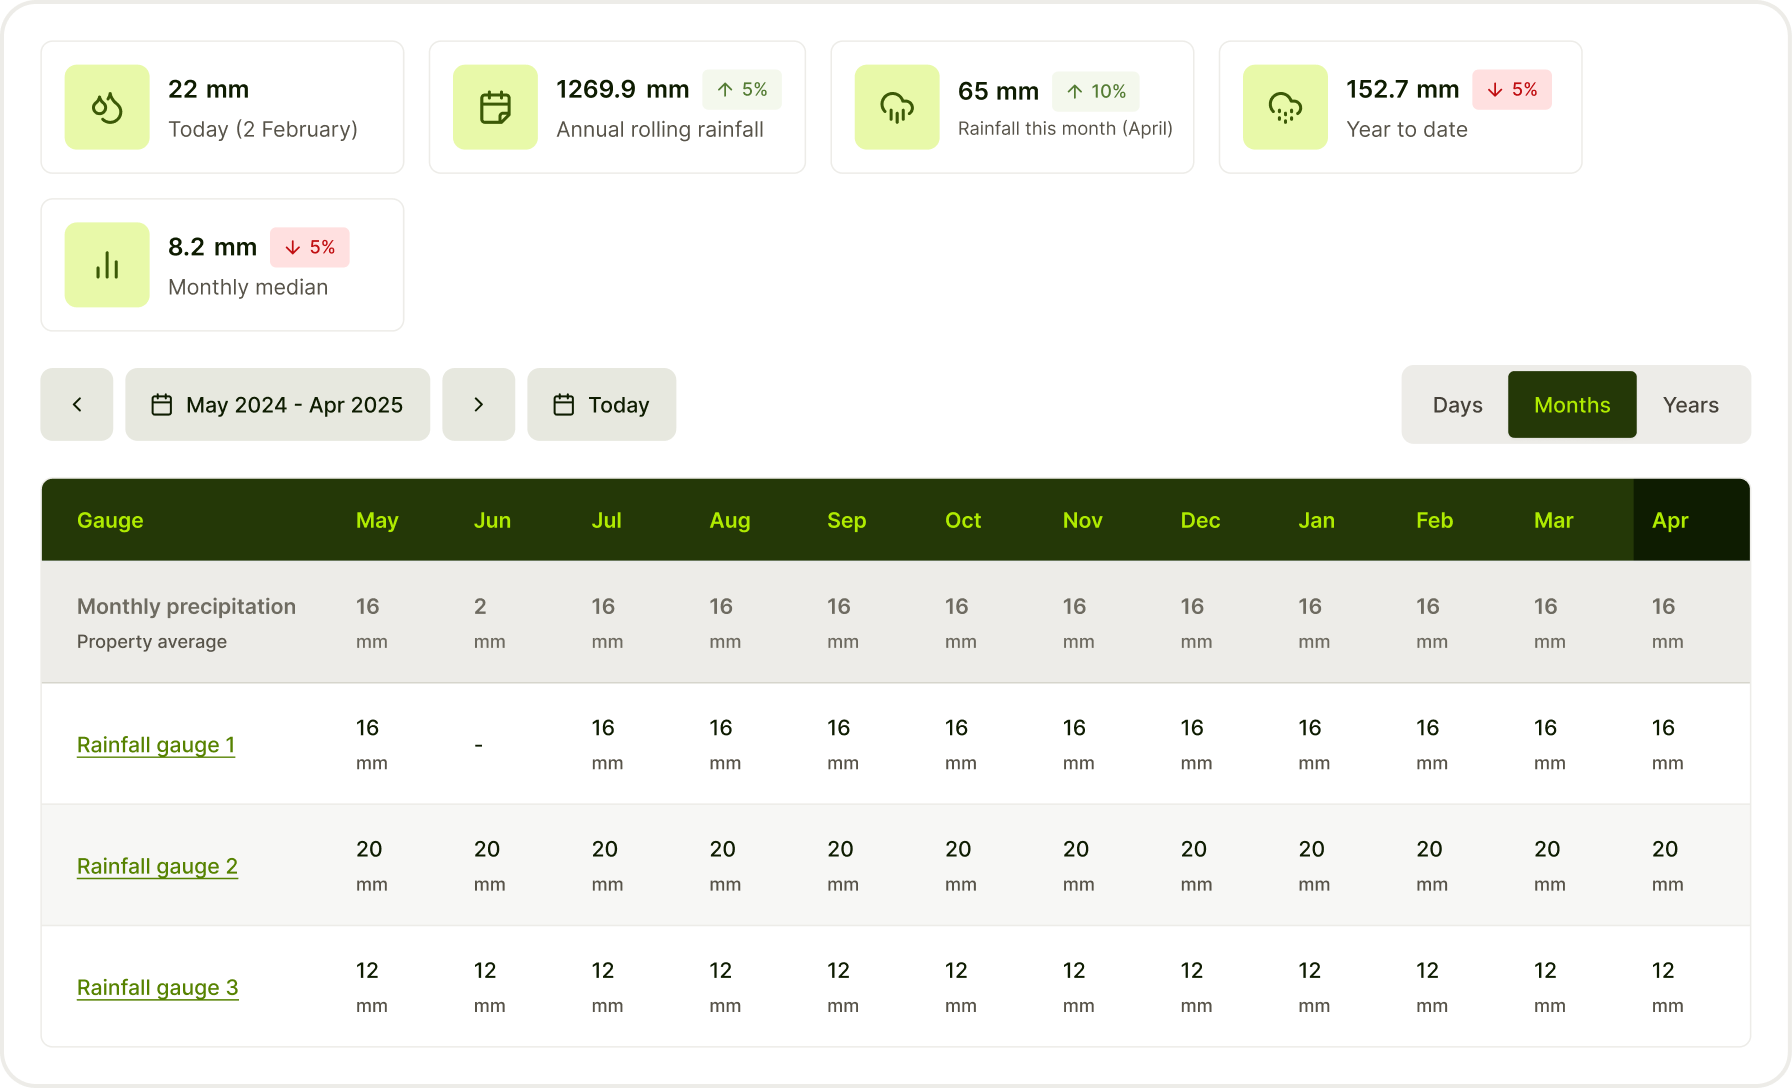
Initial calendar view didn't scale when multiple rainfall sites were linked. Too much visual scanning for what should be at-a-glance. Pivoted to a linear table view that lets users compare site status from a single bird's-eye row.
Outcome
Stakeholder confidence
Increased delivery velocity built confidence in both product direction and continued investment.
Design ahead of engineering
Design consistently stayed ahead of engineering, reducing ambiguity and downstream rework.
Patterns / +1 designer effect
Established patterns compounded design impact, enabling one designer to support more surface area.